Spiral Galaxy Rotation Curve Builder
The rotation curves of spiral galaxies are the standard way to
introduce students to the evidence for dark matter. I wanted a good
publicly available tool which lets students adjust the amounts of dark
and luminous matter and see for themselves what happens to the
rotation curve, so I suggested this as a project for Bethany
Baldwin-Pulcini and Steven Hyatt in winter quarter 2014. They built a
tool which should be useful to many astronomy students.
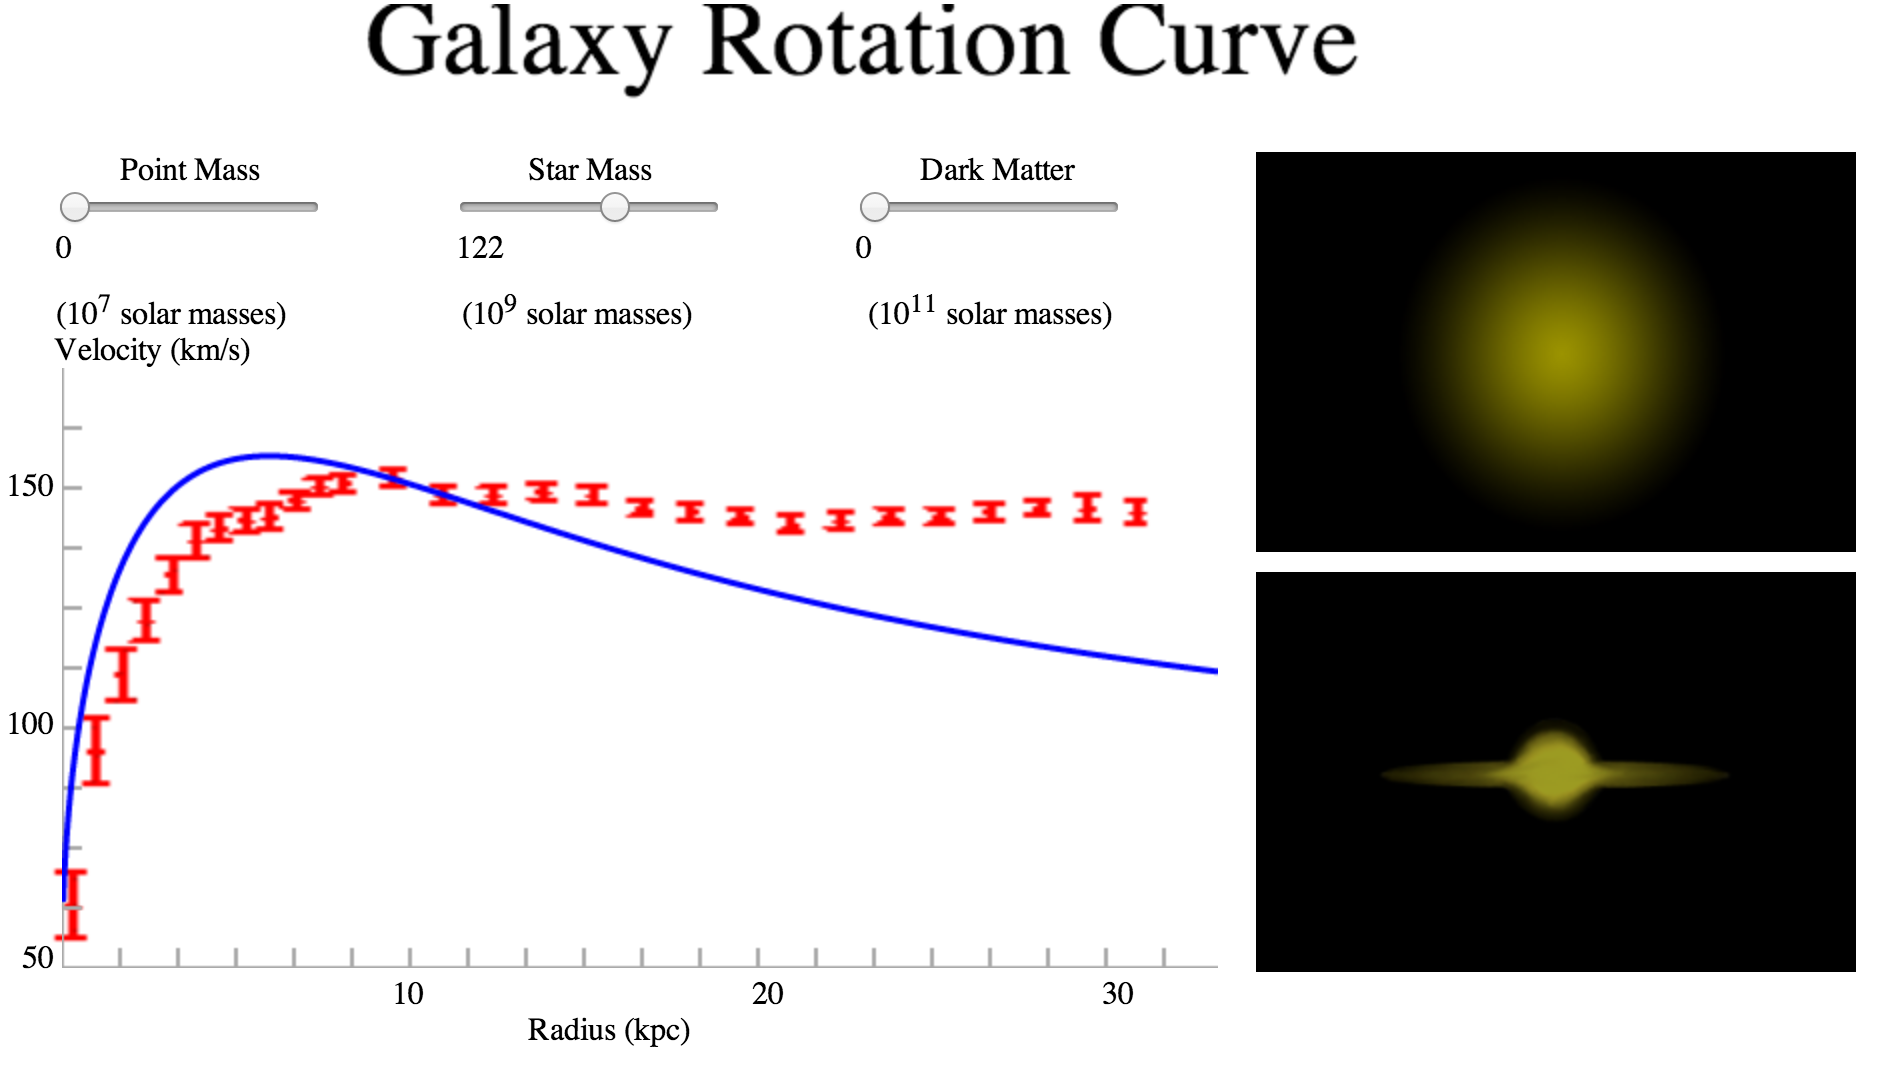
A common misconception is that dark matter = black hole. This
interactive tool helps students realize that the supermassive black
hole at the center of a typical spiral galaxy cannot account for the
observed rotation curve, both because of the shape of the curve and
the overall amount of mass.
 | |
Click on the image to start. |
Details: the model for the mass in stars follows an
exponential density distribution, as does the light from the disk in a
typical disk galaxy. The students integrated over this disk to find
the enclosed stellar mass at any given radius. The slider controls
the normalization only (in other words, the mass-to-light ratio). The
dark matter is modeled as having density proportional to
1/(a2+r2) (where a is some constant) so that it
is proportional to r-2 at large r (where it provides the
flat rotation curve after being integrated over a sphere) but tends
toward constant density at small r (to avoid the rotation curve being
flat all the way in to an infinite-density center). The slider again
controls the normalization only.
Back to main Interactive Figures for Astrophysics page.